Measuring RAG Performance: Metrics That Actually Tell You Something
A RAG pipeline produces fluent answers from day one — whether or not they are correct. Here is how to measure RAG performance properly: retriever, generator and end-to-end metrics, why overlap scores like BLEU mislead, how to wire it all into a test suite with DeepEval, and what a measured benchmark of six RAG pipelines reveals.
Measuring RAG Performance: Metrics That Actually Tell You Something
Retrieval-Augmented Generation is easy to stand up and surprisingly hard to trust. A pipeline that embeds your documents, retrieves a few chunks, and asks an LLM to answer will produce fluent, confident responses on day one — whether or not those responses are correct. In enterprise settings, and especially in regulated domains, fluent is not the bar. Verifiable is. The only way to get there is to measure.
The mistake most teams make is to judge a RAG system by reading a handful of answers and nodding. That tells you almost nothing about why an answer was good or bad, and nothing at all about whether the next thousand answers will hold up. This article lays out how to measure RAG properly — the metrics that matter, why generic text-overlap scores mislead, and how I wire all of it into a test suite with DeepEval.
Why a single score is never enough
A RAG pipeline fails in three different places, and a single end-to-end number cannot tell them apart:
A wrong final answer can originate in any of these stages, and the fix is completely different in each. If the right chunk was never retrieved, no amount of prompt engineering will save the generator. If retrieval was perfect but the model invented a detail, the retriever is not your problem. So the first principle of RAG evaluation is simple: score the retriever, the generator, and the end-to-end system separately.
The RAG Triad
A useful mental model, popularised by TruLens, frames evaluation as three relationships between the three objects in any RAG interaction — the query, the context, and the response:
Score all three highly and you have, in TruLens's words, a system that is verified free of hallucination up to the limits of its knowledge base. The elegant part: none of the three needs a labelled ground-truth answer, so they can run on live production traffic.
Measuring the retriever
Retrieval is, at heart, a ranking problem — so it inherits decades of information-retrieval metrics. These need ground-truth relevance labels (you must know which documents are relevant for each query):
When you do not have labels — which is most of the time — the LLM-judged variants step in: context precision (are relevant chunks ranked above the noise?), context recall (does the context contain everything needed?), and context relevancy (what is the signal-to-noise ratio?). Each one points at a specific knob: weak recall means you tune the embedding model, chunk size, or top-K; weak precision means you add a reranker.
Measuring the generator
Once the context is good, the question becomes whether the model used it well:
It is tempting to reach for classical overlap metrics here — BLEU, ROUGE, BERTScore. Don't, at least not as your headline numbers. They reward surface n-gram overlap, never check whether the answer is grounded, and demand a single reference answer. A valid paraphrase scores low; a confident hallucination that happens to echo the reference scores high. They measure the wrong thing.
LLM-as-a-judge and G-Eval
The metrics that genuinely correlate with human judgement use a strong LLM as the judge. The leading method, G-Eval, prompts the model with explicit criteria, has it write its own chain-of-thought evaluation steps, and then fills in a score weighted by token probability for fine-grained results. Databricks found this kind of judge agrees with human graders more than 80% of the time — far better than any n-gram metric.
It is not free of pitfalls, and a serious evaluation discloses them. Judges show position bias (swap the order and average), verbosity bias (longer is not better), and self-preference (they favour their own text). Scores are non-deterministic, so fix the temperature low, around 0.1. And running a frontier model on every example is expensive — prototype on a strong model, then ship a cheaper few-shot judge.
DeepEval: turning metrics into a test suite
Concepts are nice; a gate in your CI pipeline is better. The framework I keep returning to is DeepEval — an open-source, pytest-native evaluation library that implements everything above and proved its worth on a previous engagement. It ships exactly five RAG metrics, cleanly split by component:
AnswerRelevancyMetric, FaithfulnessMetricContextualRelevancyMetric, ContextualPrecisionMetric, ContextualRecallMetricEvery metric returns a score in [0, 1], passes at a threshold (0.5 by default), and — crucially — returns a natural-language reason for the score, so a failure is debuggable rather than mysterious. The three referenceless metrics form DeepEval's RAG triad and can run against production traffic:
from deepeval import evaluate
from deepeval.test_case import LLMTestCase
from deepeval.metrics import (
    AnswerRelevancyMetric,
    FaithfulnessMetric,
    ContextualRelevancyMetric,
)

test_case = LLMTestCase(
    input="Which suppliers are approved for indirect materials?",
    actual_output=rag_pipeline(query),
    retrieval_context=retrieved_chunks,
)

evaluate(
    test_cases=[test_case],
    metrics=[
        AnswerRelevancyMetric(threshold=0.8),
        FaithfulnessMetric(threshold=0.9),
        ContextualRelevancyMetric(threshold=0.7),
    ],
)
The real payoff is the mapping from a failing score to an exact knob. Low contextual recall? Tune the embedding model, chunk size, or top-K. Low contextual precision? Add or improve the reranker. Low answer relevancy or faithfulness? The problem is on the generation side — the prompt, the model, or the temperature. With assert_test and deepeval test run, those thresholds become CI/CD gates that fail the build on a regression, and the Synthesizer will even generate a starter golden dataset from your own documents.
From the lab: six pipelines, measured
To pressure-test all of this on real documents, I built an open benchmark — RAG Lab — that runs six RAG pipelines over the same corpus and scores them end-to-end with DeepEval. The pipelines: Plain Hybrid (dense + BM25), RAG + Reranker (a Jina v2 cross-encoder over a wider candidate pool), HyDE (retrieve on a hypothetical answer), Corrective RAG (grade and re-query when retrieval is weak), Agentic RAG (an agent that plans and reflects over up to three retrieval rounds), and GraphRAG (a knowledge graph with entity anchoring).
The evaluation set is 100 synthesised goldens — 50 single-hop (answerable from a single document) and 50 multi-hop (require combining two documents) — judged locally, with all six DeepEval metrics populated. Composite is the mean of the six.
The lab UI
RAG Lab ships a small Vue dashboard (FastAPI backend) for working with all of this interactively. Four tabs: Index & Eval orchestrates embedding, graph building, golden synthesis and the eval run; Chat / Explore lets you query any of the six approaches and inspect the retrieved chunks, citations and the full retrieval trace; the DeepEval Dashboard compares every approach on a radar chart, per-metric bars and a sortable summary table; and Goldens browses the synthesised evaluation set.
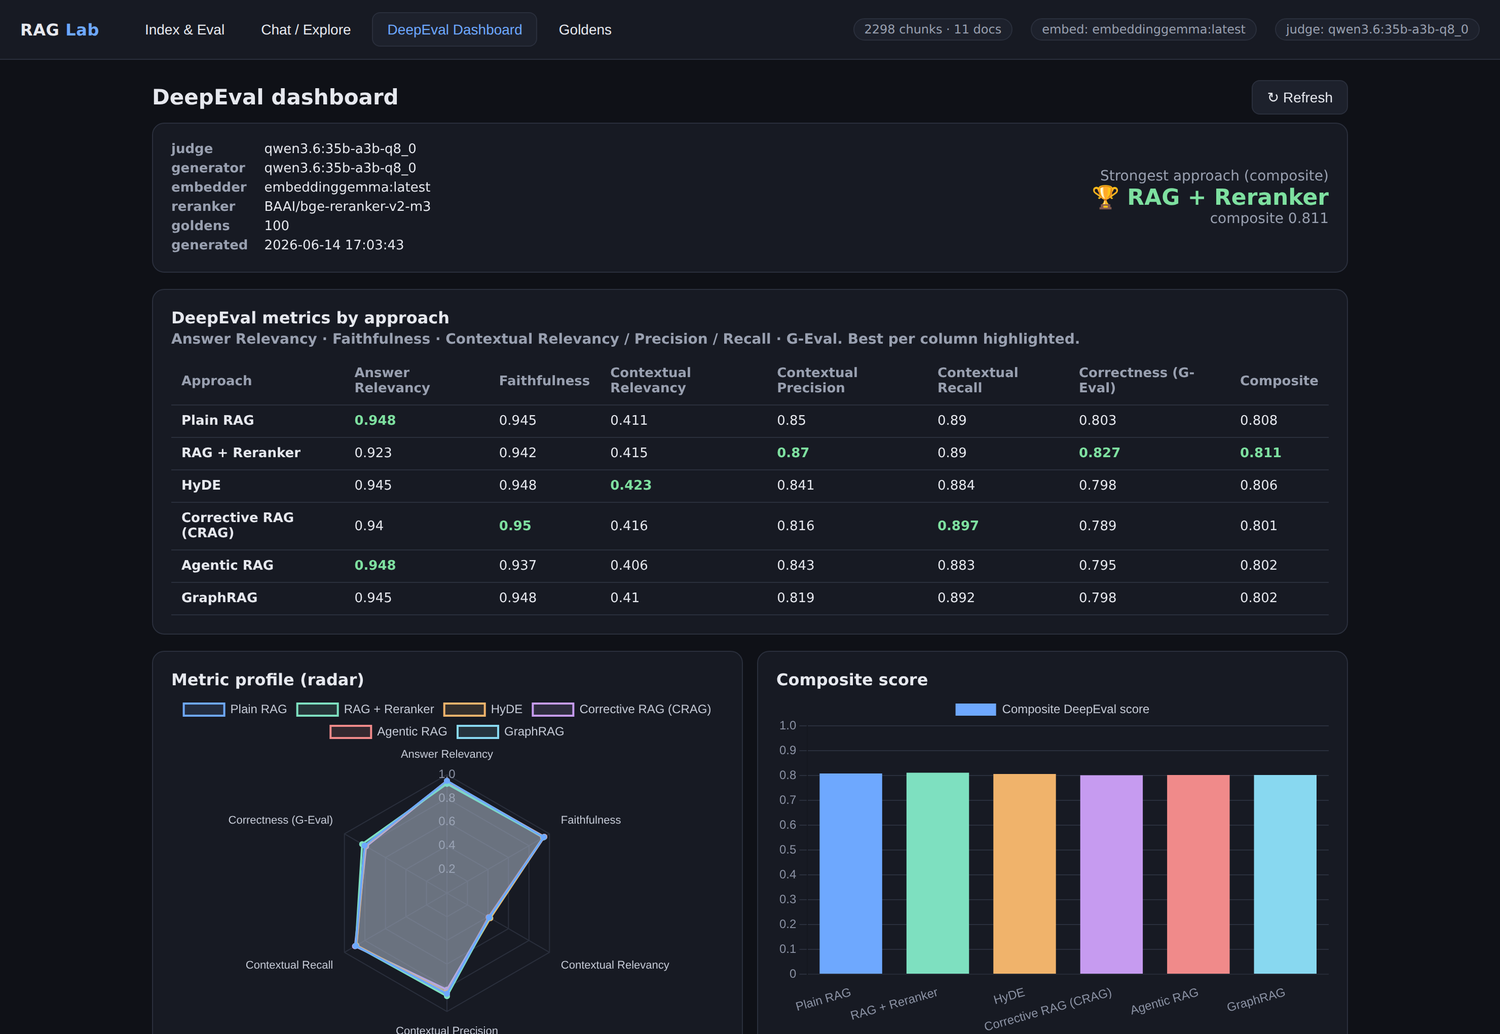
This is an educational / demo project, not a production system — a sandbox for seeing, side by side, what each retrieval strategy is actually worth on a measured benchmark.
Composite scores
| Approach | Composite | Gold-chunk hit | Single-hop | Multi-hop |
|---|---|---|---|---|
| RAG + Reranker | 0.811 | 94% | 0.826 | 0.796 |
| Plain Hybrid | 0.808 | 93% | 0.816 | 0.800 |
| HyDE | 0.806 | 93% | 0.815 | 0.798 |
| Agentic RAG | 0.802 | 93% | 0.812 | 0.792 |
| GraphRAG | 0.802 | 92% | 0.801 | 0.803 |
| Corrective RAG | 0.801 | 86% | 0.818 | 0.785 |
Per-metric breakdown
| Approach | Ans. Rel. | Faithful. | Ctx. Rel. | Ctx. Prec. | Ctx. Rec. | G-Eval |
|---|---|---|---|---|---|---|
| Plain Hybrid | 0.948 | 0.945 | 0.411 | 0.850 | 0.890 | 0.803 |
| RAG + Reranker | 0.923 | 0.942 | 0.415 | 0.870 | 0.890 | 0.827 |
| HyDE | 0.945 | 0.948 | 0.423 | 0.841 | 0.884 | 0.798 |
| Corrective RAG | 0.940 | 0.950 | 0.416 | 0.816 | 0.897 | 0.789 |
| Agentic RAG | 0.948 | 0.937 | 0.406 | 0.843 | 0.883 | 0.795 |
| GraphRAG | 0.945 | 0.948 | 0.410 | 0.819 | 0.892 | 0.798 |
What the numbers say
Strengths and weaknesses of each approach
The benchmark makes the trade-offs concrete. What this implementation demonstrates, approach by approach:
The full lab — all six pipelines, the DeepEval harness, a Vue dashboard, and the raw results — is open source: github.com/pauloesterwitz/RAG-Lab.
A practical playbook
Putting it together, here is the sequence I follow on enterprise engagements:
Conclusion
The interesting question is no longer "can the model answer?" but "can you prove the answer is good?" Grounding a RAG system in metrics — split by component, judged where overlap scores fail, and wired into CI — is what turns a promising proof of concept into something you can put in front of an auditor. Build the RAG system, yes. But measuring it is what makes it trustworthy.

Paul Oesterwitz
AI & SAP Consultant · PhD Researcher